


Simpler Trading – Weekly Price Statistics Indicator
Original price was: $297.00.$33.00Current price is: $33.00.
See all our reviews

Simpler Trading – Weekly Price Statistics Indicator: Advanced Statistical Tool for Short-Term Options Trading
What Is The Simpler Trading – Weekly Price Statistics Indicator?
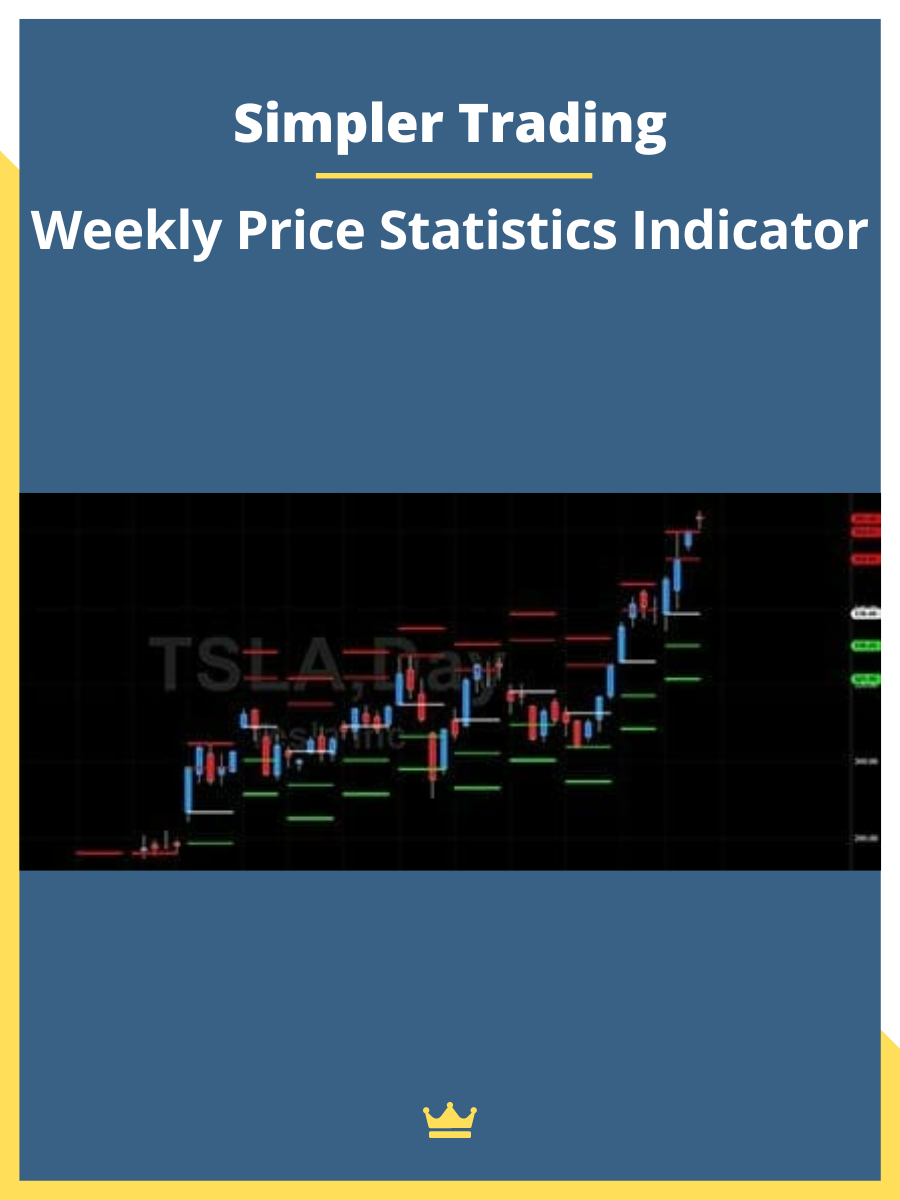
The Simpler Trading – Weekly Price Statistics Indicator is a quantitative technical analysis tool designed to project statistically probable price ranges for the current trading week. Built with the same robust statistical methodology as the Two Week Stats Tool, this indicator empowers traders to make data-driven decisions by calculating one and two standard deviation levels from the week’s opening price on daily charts.
Why Choose Simpler Trading’s Weekly Price Statistics Indicator?
-
Credibility: Developed by trusted experts at Simpler Trading.
-
Clarity: Easy to interpret even for intermediate traders.
-
Strategic Edge: Helps you make more confident trades backed by probability, not just gut instinct.
-
Income-Focused: Ideal for options traders who need precise, time-sensitive price ranges.
Core Functionality and Statistical Power
How the Weekly Price Statistics Indicator Works
The indicator leverages historical price data and statistical probability theory to:
- Calculate expected weekly high and low price ranges based on historical volatility patterns
- Display clear visual markers showing one and two standard deviation levels above and below the weekly open
- Provide real-time statistical odds of price movements exceeding projected ranges
- Enable precise risk assessment for short-term trading strategies
Key Statistical Advantages
Unlike traditional technical indicators that rely on lagging data, the Weekly Price Statistics Indicator offers:
- Forward-looking projections based on statistical probability
- Quantifiable confidence levels for price movement predictions
- Historical accuracy metrics that validate the indicator’s reliability
- Dynamic adjustment to changing market volatility conditions
Essential Features and Trading Benefits
1. Statistical Edge Through Quantitative Analysis
The indicator transforms complex historical data into actionable trading intelligence by:
- Analyzing multiple timeframes of price movement patterns
- Calculating probability distributions for expected price ranges
- Providing numerical confidence levels for each projection
- Offering backtested accuracy rates to validate predictions
2. Enhanced Visual Clarity for Technical Analysis
Clear chart overlays display:
- Distinctive colored lines indicating one and two standard deviation levels
- Dynamic price zones showing statistically probable support and resistance areas
- Real-time updates as market conditions evolve
- Intuitive visual hierarchy that doesn’t clutter your existing chart setup
3. Advanced Risk Management Capabilities
The indicator enhances risk management protocols by:
- Defining statistically valid stop-loss levels based on probability theory
- Identifying optimal take-profit targets within expected ranges
- Calculating risk-reward ratios using statistical confidence levels
- Providing position sizing guidance based on volatility metrics
4. Options Trading Strategy Optimization
Specifically designed for short-term options income strategies, the tool helps:
- Structure credit spreads with statistically optimal strike prices
- Time iron condors based on expected weekly price ranges
- Manage weekly options positions with data-driven adjustments
- Calculate probability of profit for various options strategies
PROOF OF COURSE:

Who Benefits Most from the Weekly Price Statistics Indicator?
Options Traders Specializing in Short-Term Income Strategies
The indicator is particularly valuable for traders who:
- Focus on weekly options expirations and need precise price projections
- Implement premium-selling strategies requiring accurate range predictions
- Seek consistent income generation through statistical edge trading
- Value quantitative analysis over subjective technical interpretation
Daily Chart Technical Analysts
Optimized for daily timeframes, this tool serves traders who:
- Analyze daily candlestick patterns for entry and exit signals
- Need reliable support and resistance levels based on statistical probability
- Combine multiple technical indicators for confirmation
- Require clean, uncluttered chart visualization
Risk-Conscious Traders Seeking Statistical Confidence
Ideal for disciplined traders who:
- Prioritize capital preservation through data-driven risk management
- Demand measurable edge before entering positions
- Build systematic trading strategies based on probability
- Track performance metrics against statistical expectations
Practical Applications and Trading Scenarios
Weekly Options Income Generation
- Credit Spread Optimization: Place short strikes outside the statistical range for higher probability of success
- Iron Condor Construction: Define wing strikes using one and two standard deviation levels
- Calendar Spread Timing: Identify optimal entry points based on volatility projections
Swing Trading Enhancement
- Entry Point Validation: Confirm technical setups with statistical probability
- Position Sizing: Adjust trade size based on confidence levels
- Profit Target Setting: Use statistical ranges for realistic expectations
Risk Management Implementation
- Stop-Loss Placement: Set stops beyond statistically significant levels
- Portfolio Hedging: Structure protective positions based on expected ranges
- Volatility Assessment: Gauge market conditions through range expansion/contraction
Technical Specifications and Integration
Platform Compatibility
The Simpler Trading – Weekly Price Statistics Indicator integrates seamlessly with:
- ThinkorSwim (TOS) platform for advanced charting
- Daily chart timeframes for optimal statistical accuracy
- Multiple asset classes including stocks, ETFs, and indices
- Existing technical analysis setups without interference
Customization Options
Traders can adjust:
- Standard deviation multipliers for different confidence levels
- Visual appearance including colors and line styles
- Alert thresholds for price approaching statistical boundaries
- Historical lookback periods for calculation refinement
Conclusion: Your Statistical Edge in Short-Term Trading
The Simpler Trading – Weekly Price Statistics Indicator represents a significant advancement in quantitative technical analysis tools. By combining proven statistical methodology with practical trading applications, this indicator provides the measurable edge that serious traders demand.
What sets this tool apart is its ability to transform complex statistical concepts into simple, actionable trading intelligence. Whether you’re structuring weekly options trades, managing swing positions, or simply seeking better risk management, this indicator delivers the data-driven confidence needed for consistent trading success.
For traders committed to elevating their performance through statistical analysis and probability-based decision making, the Weekly Price Statistics Indicator isn’t just another technical tool—it’s your quantitative advantage in today’s competitive markets.
After you make payment, we will send the link to your email then you can download the course anytime, anywhere you want. Our file hosted on Pcloud, Mega.Nz and Google-Drive
LOADCOURSE – The Difference You Make
More Courses: FOREX & TRADING
Q & A
Related products


Forex & Trading

Forex & Trading

Forex & Trading

Forex & Trading

Forex & Trading

Forex & Trading
Forex & Trading
Reviews
There are no reviews yet